代码拉取完成,页面将自动刷新

Netdata is distributed, real-time, performance and health monitoring for systems and applications. It is a highly optimized monitoring agent you install on all your systems and containers.
Netdata provides unparalleled insights, in real-time, of everything happening on the systems it runs (including web servers, databases, applications), using highly interactive web dashboards. It can run autonomously, without any third party components, or it can be integrated to existing monitoring tool chains (Prometheus, Graphite, OpenTSDB, Kafka, Grafana, etc).
Netdata is fast and efficient, designed to permanently run on all systems (physical & virtual servers, containers, IoT devices), without disrupting their core function.
Netdata is free, open-source software and it currently runs on Linux, FreeBSD, and MacOS.
Netdata is not hosted by the CNCF but is the 3rd most starred open-source project in the Cloud Native Computing Foundation (CNCF) landscape.
People get addicted to Netdata.
Once you use it on your systems, there is no going back! You have been warned...
The following animated image, shows the top part of a typical Netdata dashboard.
A typical Netdata dashboard, in 1:1 timing. Charts can be panned by dragging them, zoomed in/out with SHIFT + mouse wheel, an area can be selected for zoom-in with SHIFT + mouse selection. Netdata is highly interactive and real-time, optimized to get the work done!
We have a few online demos to experience it live: https://www.netdata.cloud
Netdata is used by hundreds of thousands of users all over the world. Check our GitHub watchers list. You will find people working for Amazon, Atos, Baidu, Cisco Systems, Citrix, Deutsche Telekom, DigitalOcean, Elastic, EPAM Systems, Ericsson, Google, Groupon, Hortonworks, HP, Huawei, IBM, Microsoft, NewRelic, Nvidia, Red Hat, SAP, Selectel, TicketMaster, Vimeo, and many more!
We provide docker images for the most common architectures. These are statistics reported by docker hub:
When you install multiple Netdata, they are integrated into one distributed application, via a Netdata registry. This is a web browser feature and it allows us to count the number of unique users and unique Netdata servers installed. The following information comes from the global public Netdata registry we run:
in the last 24 hours:
![]()
![]()
![]()
![]()
![]()
To install Netdata from source on any Linux system (physical, virtual, container, IoT, edge) and keep it up to date with our nightly releases automatically, run the following:
# make sure you run `bash` for your shell
bash

# install Netdata directly from GitHub source
bash <(curl -Ss https://my-netdata.io/kickstart.sh)
To learn more about the pros and cons of using nightly vs. stable releases, see our notice about the two options.
The above command will:
More installation methods and additional options can be found at the installation page.
To try Netdata in a docker container, run this:
docker run -d --name=netdata \
  -p 19999:19999 \
  -v /etc/passwd:/host/etc/passwd:ro \
  -v /etc/group:/host/etc/group:ro \
  -v /proc:/host/proc:ro \
  -v /sys:/host/sys:ro \
  -v /var/run/docker.sock:/var/run/docker.sock:ro \
  --cap-add SYS_PTRACE \
  --security-opt apparmor=unconfined \
  netdata/netdata
For more information about running Netdata in docker, check the docker installation page.

From Netdata v1.12 and above, anonymous usage information is collected by default and sent to Google Analytics. To read more about the information collected and how to opt-out, check the anonymous statistics page.
Netdata has a quite different approach to monitoring.
Netdata is a monitoring agent you install on all your systems. It is:
All the above, are packaged together in a very flexible, extremely modular, distributed application.
This is how Netdata compares to other monitoring solutions:
| Netdata | others (open-source and commercial) |
|---|---|
| High resolution metrics (1s granularity) | Low resolution metrics (10s granularity at best) |
| Monitors everything, thousands of metrics per node | Monitor just a few metrics |
| UI is super fast, optimized for anomaly detection | UI is good for just an abstract view |
| Meaningful presentation, to help you understand the metrics | You have to know the metrics before you start |
| Install and get results immediately | Long preparation is required to get any useful results |
| Use it for troubleshooting performance problems | Use them to get statistics of past performance |
| Kills the console for tracing performance issues | The console is always required for troubleshooting |
| Requires zero dedicated resources | Require large dedicated resources |
Netdata is open-source, free, super fast, very easy, completely open, extremely efficient, flexible and integrate-able.
It has been designed by SysAdmins, DevOps and Developers for troubleshooting performance problems, not just visualize metrics.
Jul 9th, 2019 - Netdata v1.16.0 released!
Release v1.16.0 contains 40 bug fixes, 31 improvements and 20 documentation updates
Binary distributions. To improve the security, speed and reliability of new Netdata installations, we are delivering our own, industry standard installation method, with binary package distributions. The RPM binaries for the most common OSs are already available on packagecloud and we’ll have the DEB ones available very soon. All distributions are considered in Beta and, as always, we depend on our amazing community for feedback on improvements.
Netdata now supports TLS encryption! You can secure the communication to the web server, the streaming connections from slaves to the master and the connection to an openTSDB backend.
This version also brings two long-awaited features to Netdata’s health monitoring:
As always, we’ve introduced new collectors, 5 of them this time:
perf plugin collects system-wide CPU performance statistics from Performance Monitoring Units (PMU) using the perf_event_open() system call. You can read a wonderful article on why this is useful here.Finally, the DB Engine introduced in v1.15.0 now uses much less memory and is more robust than before.
May 21st, 2019 - Netdata v1.15.0 released!
Release v1.15.0 contains 11 bug fixes and 30 improvements.
We are very happy and proud to be able to include two major improvements in this release: The aggregated node view and the new database engine.
Aggregated node view
The No. 1 request from our community has been a better way to view and manage their Netdata installations, via an aggregated view. The node menu with the simple list of hosts on the agent UI just didn't do it for people with hundreds, or thousands of instances. This release introduces the node view, which uses the power of Netdata Cloud to deliver powerful views of a Netdata-based monitoring infrastructure. You can read more about Netdata Cloud and the future of Netdata here.
New database engine
Historically, Netdata has required a lot of memory for long-term metrics storage. To mitigate this we've been building a new DB engine for several months and will continue improving until it can become the default memory mode for new Netdata installations. The version included in release v1.15.0 already permits longer-term storage of compressed data and we'll continue reducing the required memory in following releases.
Other major additions
We have added support for the AWS Kinesis backend and new collectors for OpenVPN, the Tengine web server, ScaleIO (VxFlex OS), ioping-like latency metrics and Energi Core node instances.
We now have a new, "text-only" chart type, cpu limits for v2 cgroups, docker swarm metrics and improved documentation.
We continued improving the Kubernetes helmchart with liveness probes for slaves, persistence options, a fix for a Cannot allocate memory issue and easy configuration for the kubelet, kube-proxy and coredns collectors.
Finally, we built a process to quickly replace any problematic nightly builds and added more automated CI tests to prevent such builds from being published in the first place.
Apr 26th, 2019 - Netdata v1.14.0 released!
Release 1.14 contains 14 bug fixes and 24 improvements.
The release introduces major additions to Kubernetes monitoring, with tens of new charts for Kubelet, kube-proxy and coredns metrics, as well as significant improvements to the Netdata helm chart.
Two new collectors were added, to monitor Docker hub and Docker engine metrics.
Finally, v1.14 adds support for version 2 cgroups, OpenLDAP over TLS, NVIDIA SMI free and per process memory and configurable syslog facilities.
Mar 14th, 2019 - Netdata v1.13.0 released!
Release 1.13.0 contains 14 bug fixes and 8 improvements.
Netdata has taken the first step into the world of Kubernetes, with a beta version of a Helm chart for deployment to a k8s cluster and proper naming of the cgroup containers. We have big plans for Kubernetes, so stay tuned!
A major refactoring of the python.d plugin has resulted in a dramatic decrease of the required memory, making Netdata even more resource efficient.
We also added charts for IPC shared memory segments and total memory used.
Feb 28th, 2019 - Netdata v1.12.2 released!
Patch release 1.12.2 contains 7 bug fixes and 4 improvements.
The main motivation behind a new patch release is the introduction of a stable release channel. A "stable" installation and update channel was always on our roadmap, but it became a necessity when we realized that our users in China could not use the nightly releases published on Google Cloud. The "stable" channel is based on our official GitHub releases and uses assets hosted on GitHub.
We are also introducing a new Oracle DB collector module, implemented in Python.
Feb 21st, 2019 - Netdata v1.12.1 released!
Patch release 1.12.1 contains 22 bug fixes and 8 improvements.
Feb 14th, 2019 - Netdata v1.12.0 released!
Release 1.12 is made out of 211 pull requests and 22 bug fixes. The key improvements are:
netdata.cloud, the free Netdata service for all Netdata usersNov 22nd, 2018 - Netdata v1.11.1 released!
openldap, tor, nvidia_smi.smartd_log, cpufreq, sensors.alerta.io, conntrack_max.my-netdatamenu has been refactored.openrc service definition got a few improvements.Sep 18, 2018 - Netdata has its own organization
Netdata used to be a firehol.org project, accessible as firehol/netdata.
Netdata now has its own github organization netdata, so all github URLs are now netdata/netdata. The old github URLs, repo clones, forks, etc redirect automatically to the new repo.
Netdata is a highly efficient, highly modular, metrics management engine. Its lockless design makes it ideal for concurrent operations on the metrics.
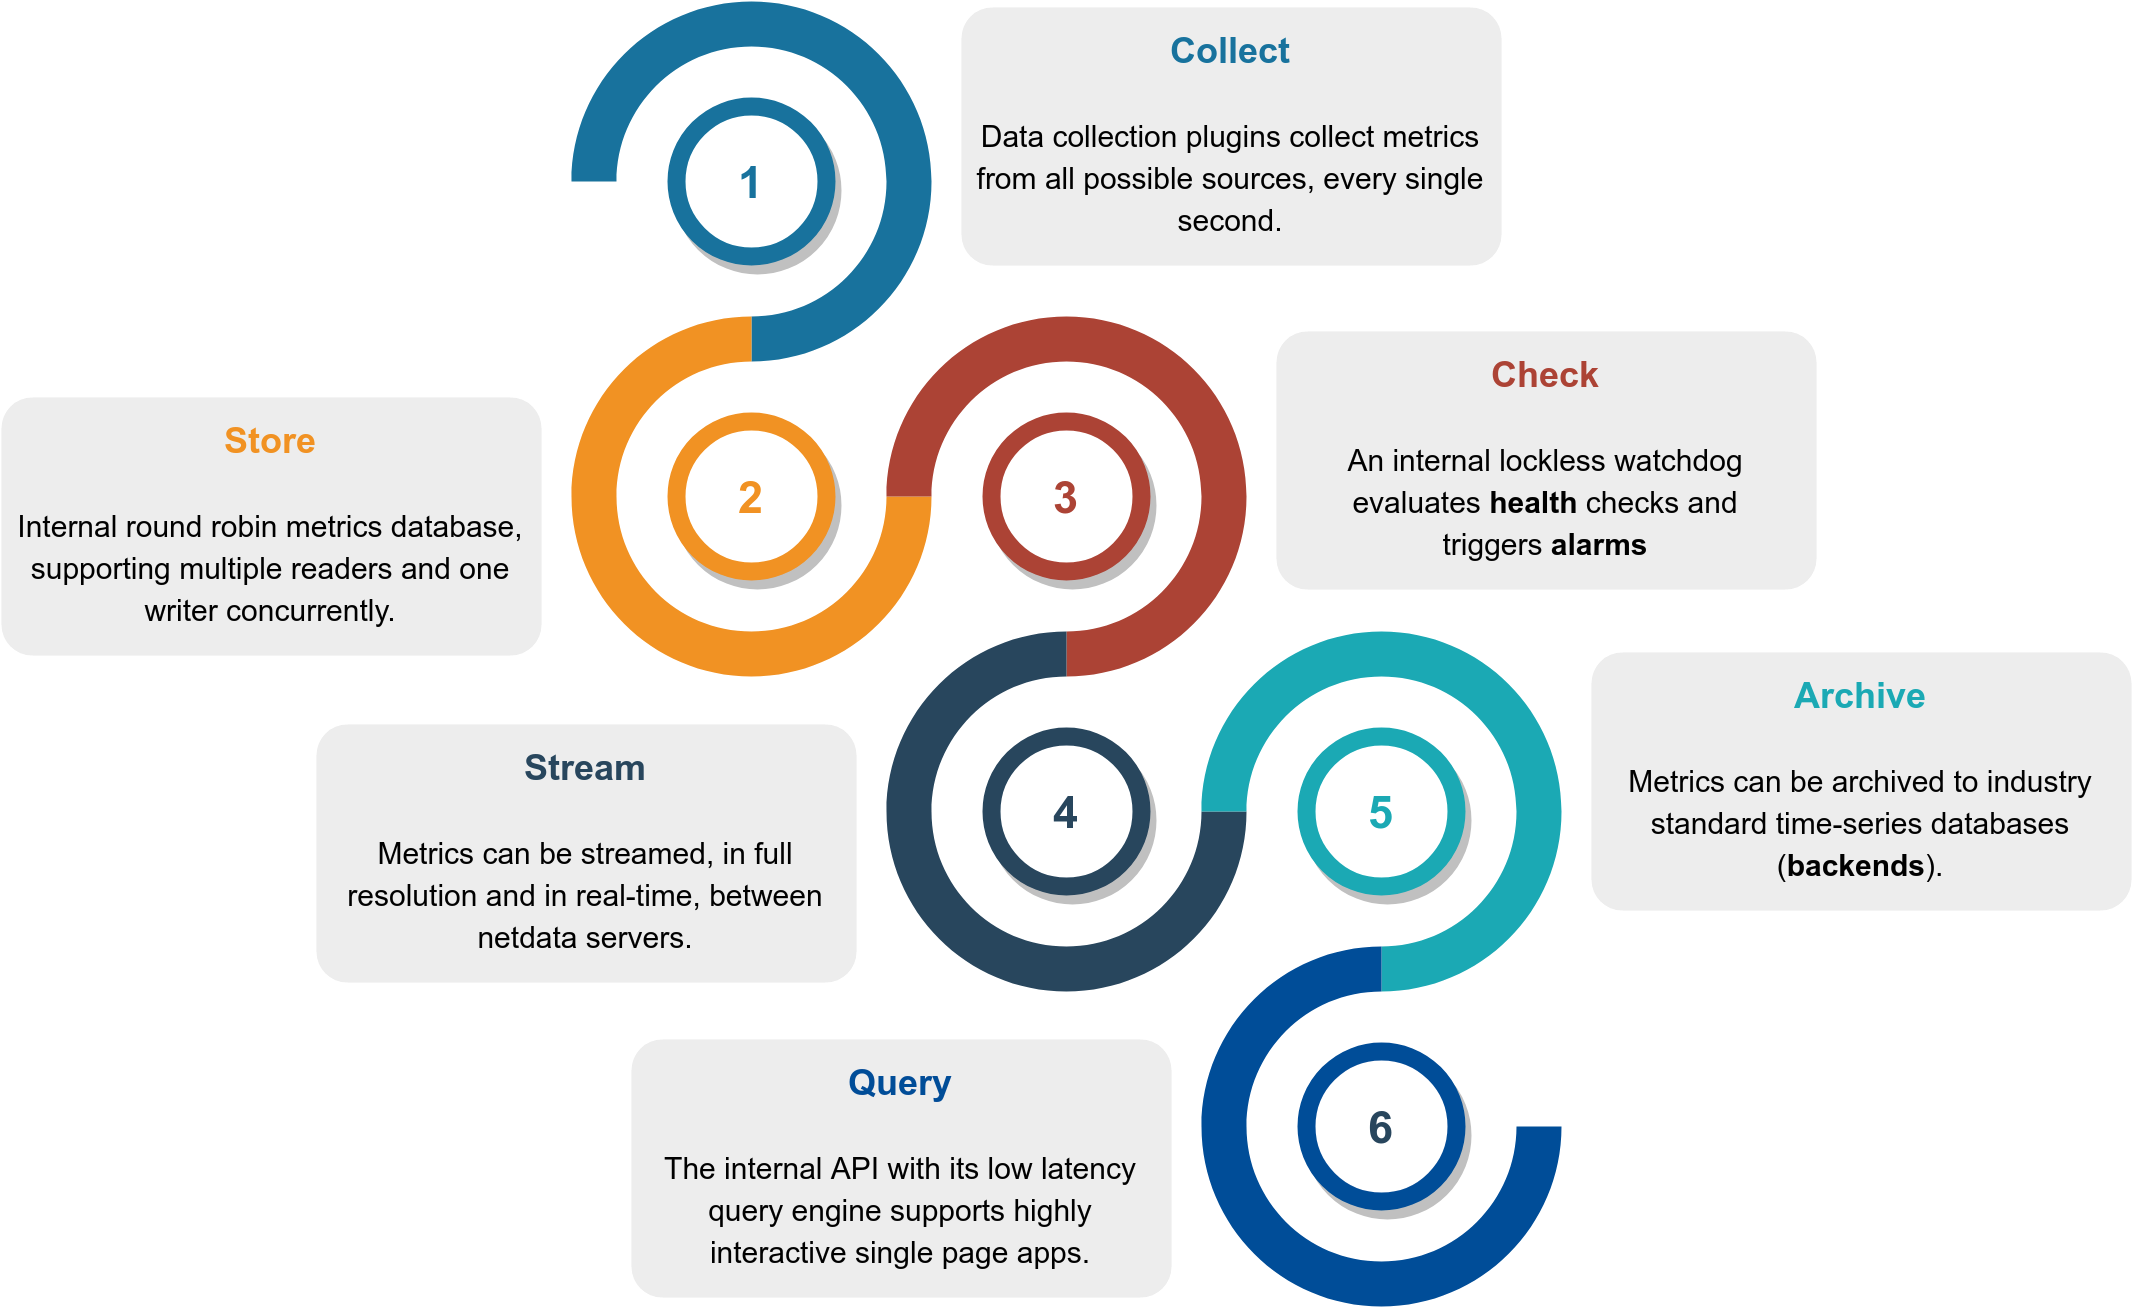
This is how it works:
| Function | Description | Documentation |
|---|---|---|
| Collect | Multiple independent data collection workers are collecting metrics from their sources using the optimal protocol for each application and push the metrics to the database. Each data collection worker has lockless write access to the metrics it collects. | collectors |
| Store | Metrics are stored in RAM in a round robin database (ring buffer), using a custom made floating point number for minimal footprint. | database |
| Check | A lockless independent watchdog is evaluating health checks on the collected metrics, triggers alarms, maintains a health transaction log and dispatches alarm notifications. | health |
| Stream | An lockless independent worker is streaming metrics, in full detail and in real-time, to remote Netdata servers, as soon as they are collected. | streaming |
| Archive | A lockless independent worker is down-sampling the metrics and pushes them to backend time-series databases. | backends |
| Query | Multiple independent workers are attached to the internal web server, servicing API requests, including data queries. | web/api |
The result is a highly efficient, low latency system, supporting multiple readers and one writer on each metric.
This is a high level overview of Netdata feature set and architecture. Click it to to interact with it (it has direct links to documentation).

This is what you should expect from Netdata:
error and access logs).slate (dark) and white.To improve clarity on charts, Netdata dashboards present positive values for metrics representing read, input, inbound, received and negative values for metrics representing write, output, outbound, sent.

Netdata charts showing the bandwidth and packets of a network interface. received is positive and sent is negative.
Netdata charts automatically zoom vertically, to visualize the variation of each metric within the visible time-frame.
A zero based stacked chart, automatically switches to an auto-scaled area chart when a single dimension is selected.
Charts on Netdata dashboards are synchronized to each other. There is no master chart. Any chart can be panned or zoomed at any time, and all other charts will follow.

Charts are panned by dragging them with the mouse. Charts can be zoomed in/out withSHIFT + mouse wheel while the mouse pointer is over a chart.
The visible time-frame (pan and zoom) is propagated from Netdata server to Netdata server, when navigating via the node menu.
To improve visual anomaly detection across charts, the user can highlight a time-frame (by pressing ALT + mouse selection) on all charts.
A highlighted time-frame can be given by pressing ALT + mouse selection on any chart. Netdata will highlight the same range on all charts.
Highlighted ranges are propagated from Netdata server to Netdata server, when navigating via the node menu.
Netdata data collection is extensible - you can monitor anything you can get a metric for. Its Plugin API supports all programing languages (anything can be a Netdata plugin, BASH, python, perl, node.js, java, Go, ruby, etc).
C.python.tc classes in real-time.hostapd).mod-status (v2.2, v2.4) and cache log statistics, for multiple servers.stub-status, for multiple servers.access.log files - extracting in real-time, web server and proxy performance metrics and applying several health checks, etc.named.stats dump file to collect real-time performance metrics. All versions of bind after 9.6 are supported.chronyc command to collect chrony statistics (Frequency, Last offset, RMS offset, Residual freq, Root delay, Root dispersion, Skew, System time).radclient command to provide freeradius statistics (authentication, accounting, proxy-authentication, proxy-accounting).You can easily extend Netdata, by writing plugins that collect data from any source, using any computer language.
The Netdata documentation is at https://docs.netdata.cloud. But you can also find it inside the repo, so by just navigating the repo on github you can find all the documentation.
Here is a quick list:
| Directory | Description |
|---|---|
installer |
Instructions to install Netdata on your systems. |
docker |
Instructions to install Netdata using docker. |
daemon |
Information about the Netdata daemon and its configuration. |
collectors |
Information about data collection plugins. |
health |
How Netdata's health monitoring works, how to create your own alarms and how to configure alarm notification methods. |
streaming |
How to build hierarchies of Netdata servers, by streaming metrics between them. |
backends |
Long term archiving of metrics to industry standard time-series databases, like prometheus, graphite, opentsdb. |
web/api |
Learn how to query the Netdata API and the queries it supports. |
web/api/badges |
Learn how to generate badges (SVG images) from live data. |
web/gui/custom |
Learn how to create custom Netdata dashboards. |
web/gui/confluence |
Learn how to create Netdata dashboards on Atlassian's Confluence. |
You can also check all the other directories. Most of them have plenty of documentation.
We welcome contributions. So, feel free to join the team.
To report bugs, or get help, use GitHub Issues.
You can also find Netdata on:
Netdata is GPLv3+.
Netdata re-distributes other open-source tools and libraries. Please check the third party licenses.
Yes.
When people first hear about a new product, they frequently ask if it is any good. A Hacker News user remarked:
Note to self: Starting immediately, all raganwald projects will have a “Is it any good?” section in the readme, and the answer shall be “yes.".
So, we follow the tradition...
These people seem to like it.
此处可能存在不合适展示的内容,页面不予展示。您可通过相关编辑功能自查并修改。
如您确认内容无涉及 不当用语 / 纯广告导流 / 暴力 / 低俗色情 / 侵权 / 盗版 / 虚假 / 无价值内容或违法国家有关法律法规的内容,可点击提交进行申诉,我们将尽快为您处理。
1. 开源生态
2. 协作、人、软件
3. 评估模型